Tire pressure is often overlooked in vehicle maintenance, yet it plays a vital role in safety, energy efficiency, and environmental impact. Properly inflated tires ensure smooth handling, improve gas mileage, and reduce wear and tear. On the other hand, under-inflated tires can lead to decreased fuel efficiency, increased emissions, and even safety risks.
Every vehicle’s tires are designed to operate at an optimal pressure, measured in pounds per square inch (psi). This pressure is determined by manufacturers to balance performance, efficiency, and safety. However, studies show that many vehicles on the road today are not meeting these standards. According to a survey by the National Highway Traffic Safety Administration (NHTSA), 28% of the cars driving on US roads have at least one tire significantly under-inflated. This issue has far-reaching consequences, particularly when it comes to energy efficiency.
When tires are under-inflated, they create more rolling resistance—the friction between the tires and the road. This resistance forces the engine to work harder, consuming more fuel. In fact, for every 1 psi drop in pressure across all four tires, fuel efficiency decreases by about 0.4%. Over time, this can lead to a significant increase in fuel consumption, costing drivers more money and contributing to unnecessary energy waste. Properly inflated tires, on the other hand, can improve gas mileage by up to 3.3%, saving drivers money at the pump while reducing their carbon footprint.
The environmental impact of under-inflated tires is another important consideration, as their inefficiency goes beyond individual vehicles and has far-reaching consequences for the planet. When tires are under-inflated, they create greater rolling resistance, which forces engines to burn more fuel. This increased fuel consumption not only raises costs for drivers but also contributes significantly to higher greenhouse gas emissions. These emissions are a leading cause of climate change, exacerbating issues like global warming, rising sea levels, and extreme weather events.
By simply maintaining proper tire pressure, drivers can reduce their fuel consumption and lower their carbon footprint. Properly inflated tires ensure that vehicles operate more efficiently, requiring less energy to move. This small but impactful action helps conserve non-renewable energy resources, such as oil and gas, which are often used to produce vehicle fuel. Additionally, fewer trips to the gas station mean a reduction in the overall demand for fuel production, refining, and transportation—processes that also generate emissions.
Proper tire maintenance is an accessible and effective way for individuals to contribute to environmental preservation. Whether it’s checking tire pressure monthly, using a tire pressure monitoring system, or ensuring regular vehicle maintenance, these habits promote sustainability and help combat climate change. On a larger scale, widespread adoption of these practices could lead to significant reductions in global energy consumption and emissions, underscoring the importance of this simple yet powerful step in protecting the environment.
Tire pressure may seem like a small detail, but its importance cannot be overstated. Ensuring tires are inflated to their recommended levels benefits drivers, vehicles, and the environment. It’s a simple habit that saves money, enhances safety, and promotes energy efficiency—proving that sometimes, small actions can make a big difference. Ready to take action? Complete the Auto Tire Pressure Activity to see these principles in action and make a real impact. For more engaging blogs and hands-on activities, visit Watt Watchers of Texas and discover more ways to save energy and protect the environment!
| Grade Level: 6, 7, 8 Theme: Transportation Activity Overview: Students will use a tire pressure gauge to determine if the tires are properly inflated. Students will learn how under inflated tires affect gas mileage for a vehicle.Time: 1 hour Materials: tire pressure gauge, clipboards, ribbons, pens, copies of Tire Pressure Worksheet Vocabulary: under-inflated, tire pressure gauge, psi, mpg Background Information: America is driving around on under-inflated tires, according to a recent survey. Under-inflated tires lower gas mileage, wasting millions of dollars each year. Under-inflated tires are also a major safety hazard. Thousands of accidents each year may be caused by poor handling due to under inflated tires. Interesting Facts: * One out of three light trucks and one out of four cars now on the road has a tire that’s significantly under-inflated according to a recent NHSTA survey. * You can improve your gas mileage by 3.3 percent by keeping your tires inflated to the proper pressure. Under-inflated tires can lower gas mileage by 0.4 percent for every 1 psi drop in pressure of all four tires. Properly inflated tires are safer and last longer. * Six percent of light trucks (sport utility vehicles, vans and pickup trucks) are driven with all four of their tires under-inflated by 8 or more psi, compared with 3 percent of passenger cars. Twenty percent of light trucks have two or more tires under -inflated by 8 or more psi, compared with 13 percent of passenger cars. * NHTSA estimates that 49 to 79 deaths and 6,585 to 10,635 injuries could be prevented annually if all vehicles were equipped with tire pressure monitoring systems. In addition, vehicle owners would benefit from better vehicle handling, increased tire life and better fuel economy. Setting the stage: Ask your students if they have ever used a tire gauge, seen their parents add air to a tire, or if they have ever had a flat tire. Discuss gas mileage and factors that may affect it, and reasons why you want better gas mileage (less gas used, less energy usage, less money) Activity 1: So, when was the last time you checked your tire pressure? Take the students out to the parking lot and show them how to check the tire pressure on a car. You may want to ask your high school auto mechanics class to bring a car over and show the students. Have the students fill out the tire pressure chart.Send a tire pressure gauge (about $2 at an auto parts store) home with your students if their parents do not have one. Include the Tire Pressure Worksheet. Have the student research the proper tire pressure for their particular car and record it on the pressure chart. Then they should record the actual tire pressure for each of the tires on the car they researched. In class, total the number of under-inflated tires. Activity 2: Calculate Efficiency Impact Students will calculate the impact on efficiency for a specific example vehicle. Either use the "demo" car from the previous activity or ask students to use the measurements that they recorded from their vehicle at home. To do this, first subtract the actual tire pressure from the recommended pressure provided by the manufacturer. This is the difference in psi from normal pressure. Then multiple the difference in pressure by 0.4. The product is the impact in percent efficiency. For example, if the manufacturer of an American mid-range light SUV recommends 35 psi per tire. The actual tire pressure is 33 psi in each tire. That is a difference of 8 psi (2 psi across 4 tires). The difference in psi times the efficiency impact of 0.4 is 3.2%. Therefore, this vehicle is suffering a 3.2% impact on efficiency. Activity 3: Teacher Tire Check Have the class survey the school parking lot. Students give ribbons and information to teachers the day before the tire check. If teachers want their tire pressures checked they put the ribbon on their dash or rearview mirrors. The class then checks all the marked cars in the lot and leaves a note card under the windshield wiper with the pressures for each tire recorded. Extension: For upper grades or as a club project you may provide an option to the tire check, an “Air Station” you set up after school to get under-inflated tires pumped up. (This will require some air compressors, hose, etc.) Or this could be coordinated with a nearby service station that would permit students to help people get their tires inflated.Handing out driving tips, recommended maintenance tips and mile per gallon calculators at the same time is a good idea. |
When we think about the weather the first thing that comes to mind is the temperature. We take a look at the weather app on our phones and dress according to the number we see. However, anyone from Houston, Miami or any tropical environment knows there's another element that plays a crucial role in how we feel when we go outside⎯ humidity. More specifically, what we are affected by most is something called relative humidity, a term meteorologists use to describe the amount of moisture (water vapor) present in the air relative to the maximum amount the air can hold at a given temperature.
Air has a capacity to hold water vapor. That capacity will change depending on the temperature. Warm air, for example, can hold more moisture, while cold air holds less. Relative humidity is a measurement that compares the actual amount of water vapor in the air to the maximum amount the air could contain. For example, when air has 100% relative humidity, it is fully saturated with moisture—think of a foggy morning when the air feels thick with moisture. At 0% humidity, the air is completely dry.
Relative humidity significantly impacts how we perceive heat. When humidity is high, sweat evaporates more slowly from our skin, making us feel hotter than the actual temperature. On the other hand, in low humidity, sweat evaporates quickly, which cools us down more efficiently.
The instrument used to measure humidity is called a hygrometer. These can range from simple analog devices to more complex digital ones, but one of the most common types, especially in classroom settings, is the sling psychrometer. This device uses two thermometers to measure the relative humidity—one "dry bulb" thermometer and one "wet bulb" thermometer.
Relative humidity plays a vital role in various industries and daily life. In weather forecasting, meteorologists rely on humidity data to predict not only how warm or cold it will feel but also the likelihood of precipitation, fog, or storms. In agriculture, controlling humidity helps farmers ensure optimal growing conditions, as excessive moisture can encourage mold growth while too little can stress crops. In indoor climate control, managing humidity is essential for comfort and health—low humidity can lead to dry skin and respiratory issues, while high humidity fosters mold and allergens. Additionally, in manufacturing, maintaining proper humidity levels is critical in processes like textile production and electronics assembly, where too much or too little moisture can compromise product quality. In the end understanding and measuring relative humidity can have far-reaching impacts, from personal comfort to large-scale industrial operations.
Understanding relative humidity not only helps us appreciate how weather affects our comfort, but it also reveals the deeper connections between climate, technology, and everyday life. Whether it's managing indoor environments, supporting agriculture, or improving industrial processes, knowing how to measure and apply humidity data is an essential skill with real-world impacts. For more exciting activities that explore the science of energy and its effects on our daily lives, visit Watt Watchers of Texas. You'll discover a wealth of interactive energy lessons, fun experiments, and insightful blogs that make learning about energy engaging and practical. Explore now and start your journey towards energy awareness!
Activity Overview: Temperature is the weather metric most obviously associated with human comfort, but humidity is the real key. Humidity is the amount of moisture in the form of water vapor in the air all around us, and it really affects how we feel in the weather. Meteorologists use the term relative humidity, which refers to the ratio of water vapor actually in the air compared to how much water vapor air can hold. In other words, fog is 100% relative humidity; the air contains as much water it can hold. The instrument used to measure relative humidity is the hygrometer. A variety of different digital and analog models exist, but you can build a simple version with your class. Known as the sling psychrometer, this hygrometer takes a measurement with a "wet bulb" thermometer and a "dry bulb" thermometer simultaneously. The difference between the measurements can be interpreted to determine the relative humidity, because evaporation over the wet bulb is directly related to how much moisture is in the air. Materials: 2"x2" cotton gauze rubber band 2 analog thermometers water folder/magazine/piece of cardboard Procedure: First, wet the cotton gauze with water. The gauze should be damp, but not dripping. Cover the bulb of one thermometer with the wet gauze, and secure the gauze to the thermometer with the rubber band. [NOTE: Some thermometers use liquid mercury, which is toxic. Take special care when working with mercury-based thermometers. If you only have these thermometers to work with, consider performing this part of the procedure as the instructor and then only allowing students to observe.] The gauze must be moist with water in order for this activity to work. Place both thermometers next to each other under the same conditions. Use a folder, magazine, or piece of cardboard to blow air over the thermometers. The fanning will not significantly change the temperature of the air, but it will catalyze evaporation, if possible. Wait several minutes for the thermometers to adjust to the temperature of the air. Water will evaporate from the gauze if relative humidity allows, slightly cooling the wet bulb thermometer and allowing a temperature difference to show between the two. Ask students to observe the temperature of the two thermometers and record the results. Then, consult the following chart to interpret the measurements from the thermometer in order to determine the relative humidity of your environment. For example, if the dry-bulb temperature is 24°C and there is a 2°C temperature difference between wet-bulb and dry-bulb temperature, then your environment has 84% relative humidity. |
In today’s fast-paced world, it’s easy to enjoy the benefits of modern technology without thinking about the resources that make it all possible. After all, people don’t need to understand energy to have access to it—so why does energy and water education matter? Why are they so important?
Now more than ever, energy and water literacy are essential. While some parts of the world enjoy seemingly unlimited access to these resources, if we don’t use them responsibly, they could become scarce in the future. In some communities, the effects of wasteful energy practices are already visible. As energy demand increases alongside environmental challenges, understanding how to use the planet's resources wisely is crucial for building a sustainable future.
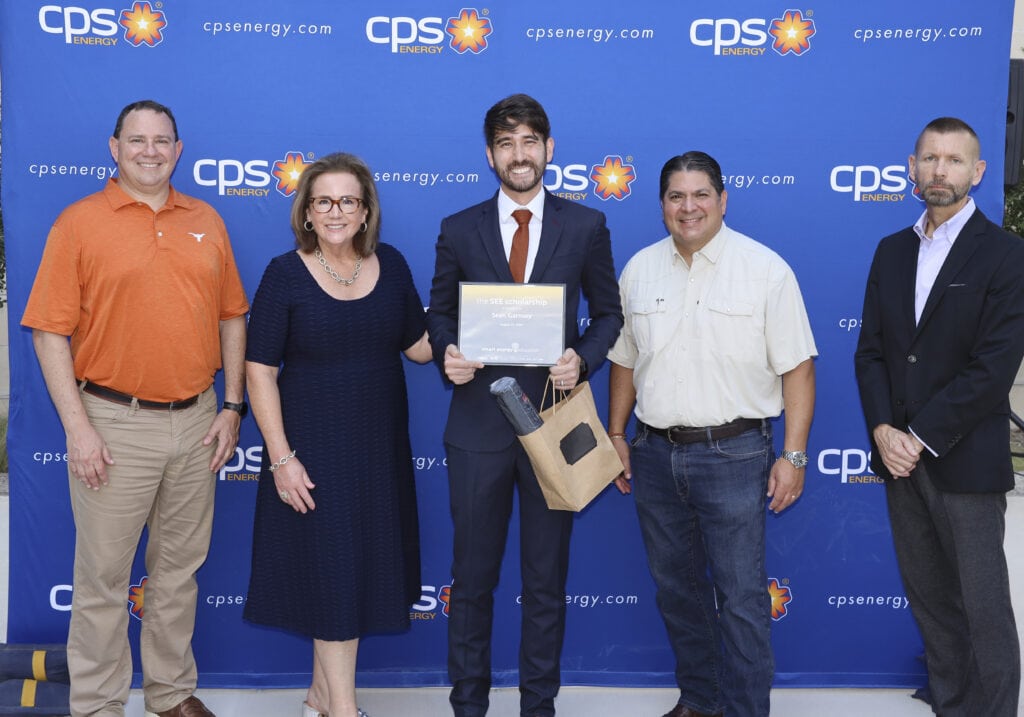
Education in these areas equips individuals and communities with the knowledge to make informed decisions that benefit both the environment and our quality of life. On August 23, 2024, CPS Energy and Itron, Inc. hosted the Smart Energy Education (SEE) Mixer to celebrate the success of the SEE Scholarship Program and honor the exceptional students who received scholarships. The event brought together students, industry leaders, and educators for a night of networking, knowledge-sharing, and celebration.
The event welcomed several esteemed VIP guests, including:
These industry leaders gathered to recognize the achievements of the scholarship recipients and to highlight the importance of energy and water education. The event was a testament to CPS Energy and Itron, Inc.'s commitment to fostering the next generation of professionals who will drive innovation in sustainability and energy conservation.
The mixer provided students with a unique chance to network with other scholarship recipients, industry leaders, and key figures in the energy sector. Several students even secured internships during the event, marking the start of their careers in the energy field. Dr. Michael E. Webber, a VIP guest, highlighted the importance of the SEE program:
"Having access to the SEE Scholarships has helped many students across the Greater San Antonio area, and we congratulate and thank CPS Energy and Itron, Inc. for their commitment and partnership in supporting energy education. Thanks to this program, students from diverse backgrounds now have the opportunity to learn about energy, sustainability, and conservation, and will use this knowledge in their future careers to create a more resourceful world."
Since 2016, the SEE Scholarship Program has awarded scholarships to more than 50 students, with over $800,000 in funding provided by CPS Energy and Itron, Inc. This initiative, managed by the San Antonio Area Foundation, continues to make a profound impact on the lives of students, empowering them to pursue careers in fields like energy, sustainability, and technology.
The mixer was a celebration of this ongoing success and underscored how education can serve as the foundation for a more sustainable and resourceful future.
For more inspiring stories and updates on the Smart Energy Education program, check out additional blog posts on the Smart Energy Education website!









Throughout human history, the pursuit of comfort has been a driving force behind many of our greatest technological advancements, with energy serving as the essential catalyst. From the mastery of fire, to the creation of desalination technology, the desire to control our environment has shaped the way we live. Notably one of the most significant milestones in this journey is the development of air conditioning, a technology that has fundamentally changed the way we experience indoor spaces.
The Historical Quest for Comfort
Humans have always sought ways to adapt their surroundings to better suit their needs. In ancient times, people relied on simple strategies such as building shelters that offered protection from the elements or using natural resources like rivers and caves to stay cool. Even the discovery and control of fire, which may now seem somewhat archaic, was revolutionary for human development, providing warmth in cold climates and enabling humans to settle in areas that were previously uninhabitable.
As people began to settle in different regions and civilizations began to grow and thrive, so did the need for more sophisticated methods of climate control. The Romans, for example, developed hypocaust systems that circulated warm air beneath floors to heat their buildings. Similarly, ancient Egyptians used evaporative cooling techniques, hanging wet reeds in doorways to cool the air as it entered their homes. These early innovations laid the groundwork for the complex systems we rely on today.
The Rise of Air Conditioning
The modern concept of air conditioning began to take shape in the 19th and early 20th centuries. Innovations in science and engineering, combined with a growing understanding of thermodynamics, set the stage for breakthroughs that would eventually lead to the development of the air conditioning systems we use today.
To fully appreciate the evolution of air conditioning, students can delve into the "History of Air Conditioning" article by Paul Lester, published by the Department of Energy. This resource provides a detailed account of the key milestones and innovations that have contributed to the modern air conditioning systems we take for granted today.
Classroom Activity: Creating a Timeline of Air Conditioning
In this activity, students will explore the history of air conditioning by analyzing the text of Lester's article. By identifying key dates and events mentioned in the prose, students will create a timeline that charts the development of this vital technology.
Procedure:
Our pursuit of comfort and energy efficiency has clearly shaped the world we enjoy today. By understanding this journey, we can spark new ideas for smarter energy use in the future. If you're eager to learn more and have a bit of fun, head over to the Watt Watchers of Texas website. With engaging activities and insightful blogs, Watt Watchers has everything you need to take the next step in your energy education and discover how you can make a real difference!
Meet Lil' Tex and Ann, the heroes of the Watt Watchers of Texas. It’s their love for the Lone Star state that drives them to conserve its valuable resources. So, it’s no surprise that they live by one simple motto, "Texas is too good to waste." But how exactly are they helping conserve Texas’ resources? Lil' Tex is quick and sharp, always ready to act, while Ann takes a more thoughtful approach, preferring to carefully plan her next move. Both use their strengths to fight against the Wasters Gang whenever they meet, making energy conservation a fun adventure for the students who come along for the ride!
Who are the Wasters Gang?— the villains of our story. Every time a light is left on in an empty room, a faucet drips without reason, or recyclables end up in the trash, you can be sure the Wasters Gang is nearby. Like any classic comic book villains, they can be defeated but never entirely eliminated—they'll always return, challenging the Watt Watchers to stay vigilant at all times.
Texas has always been a big place, but the Wasters Gang seems to have kicked it up a notch, and Lil' Tex and Ann can’t be everywhere at the same time. So, to help them tackle these new challenges, they've teamed up with their friends Lamar, Birdy, Travis, and Molly. Each bringing a fresh set of unique skills and knowledge to the table, but most importantly all dedicated to protecting Texas' resources.
Whether you're new to the Watt Watchers or need a refresher, these characters are here to help you make smart energy choices every day to help both Texas and the planet.
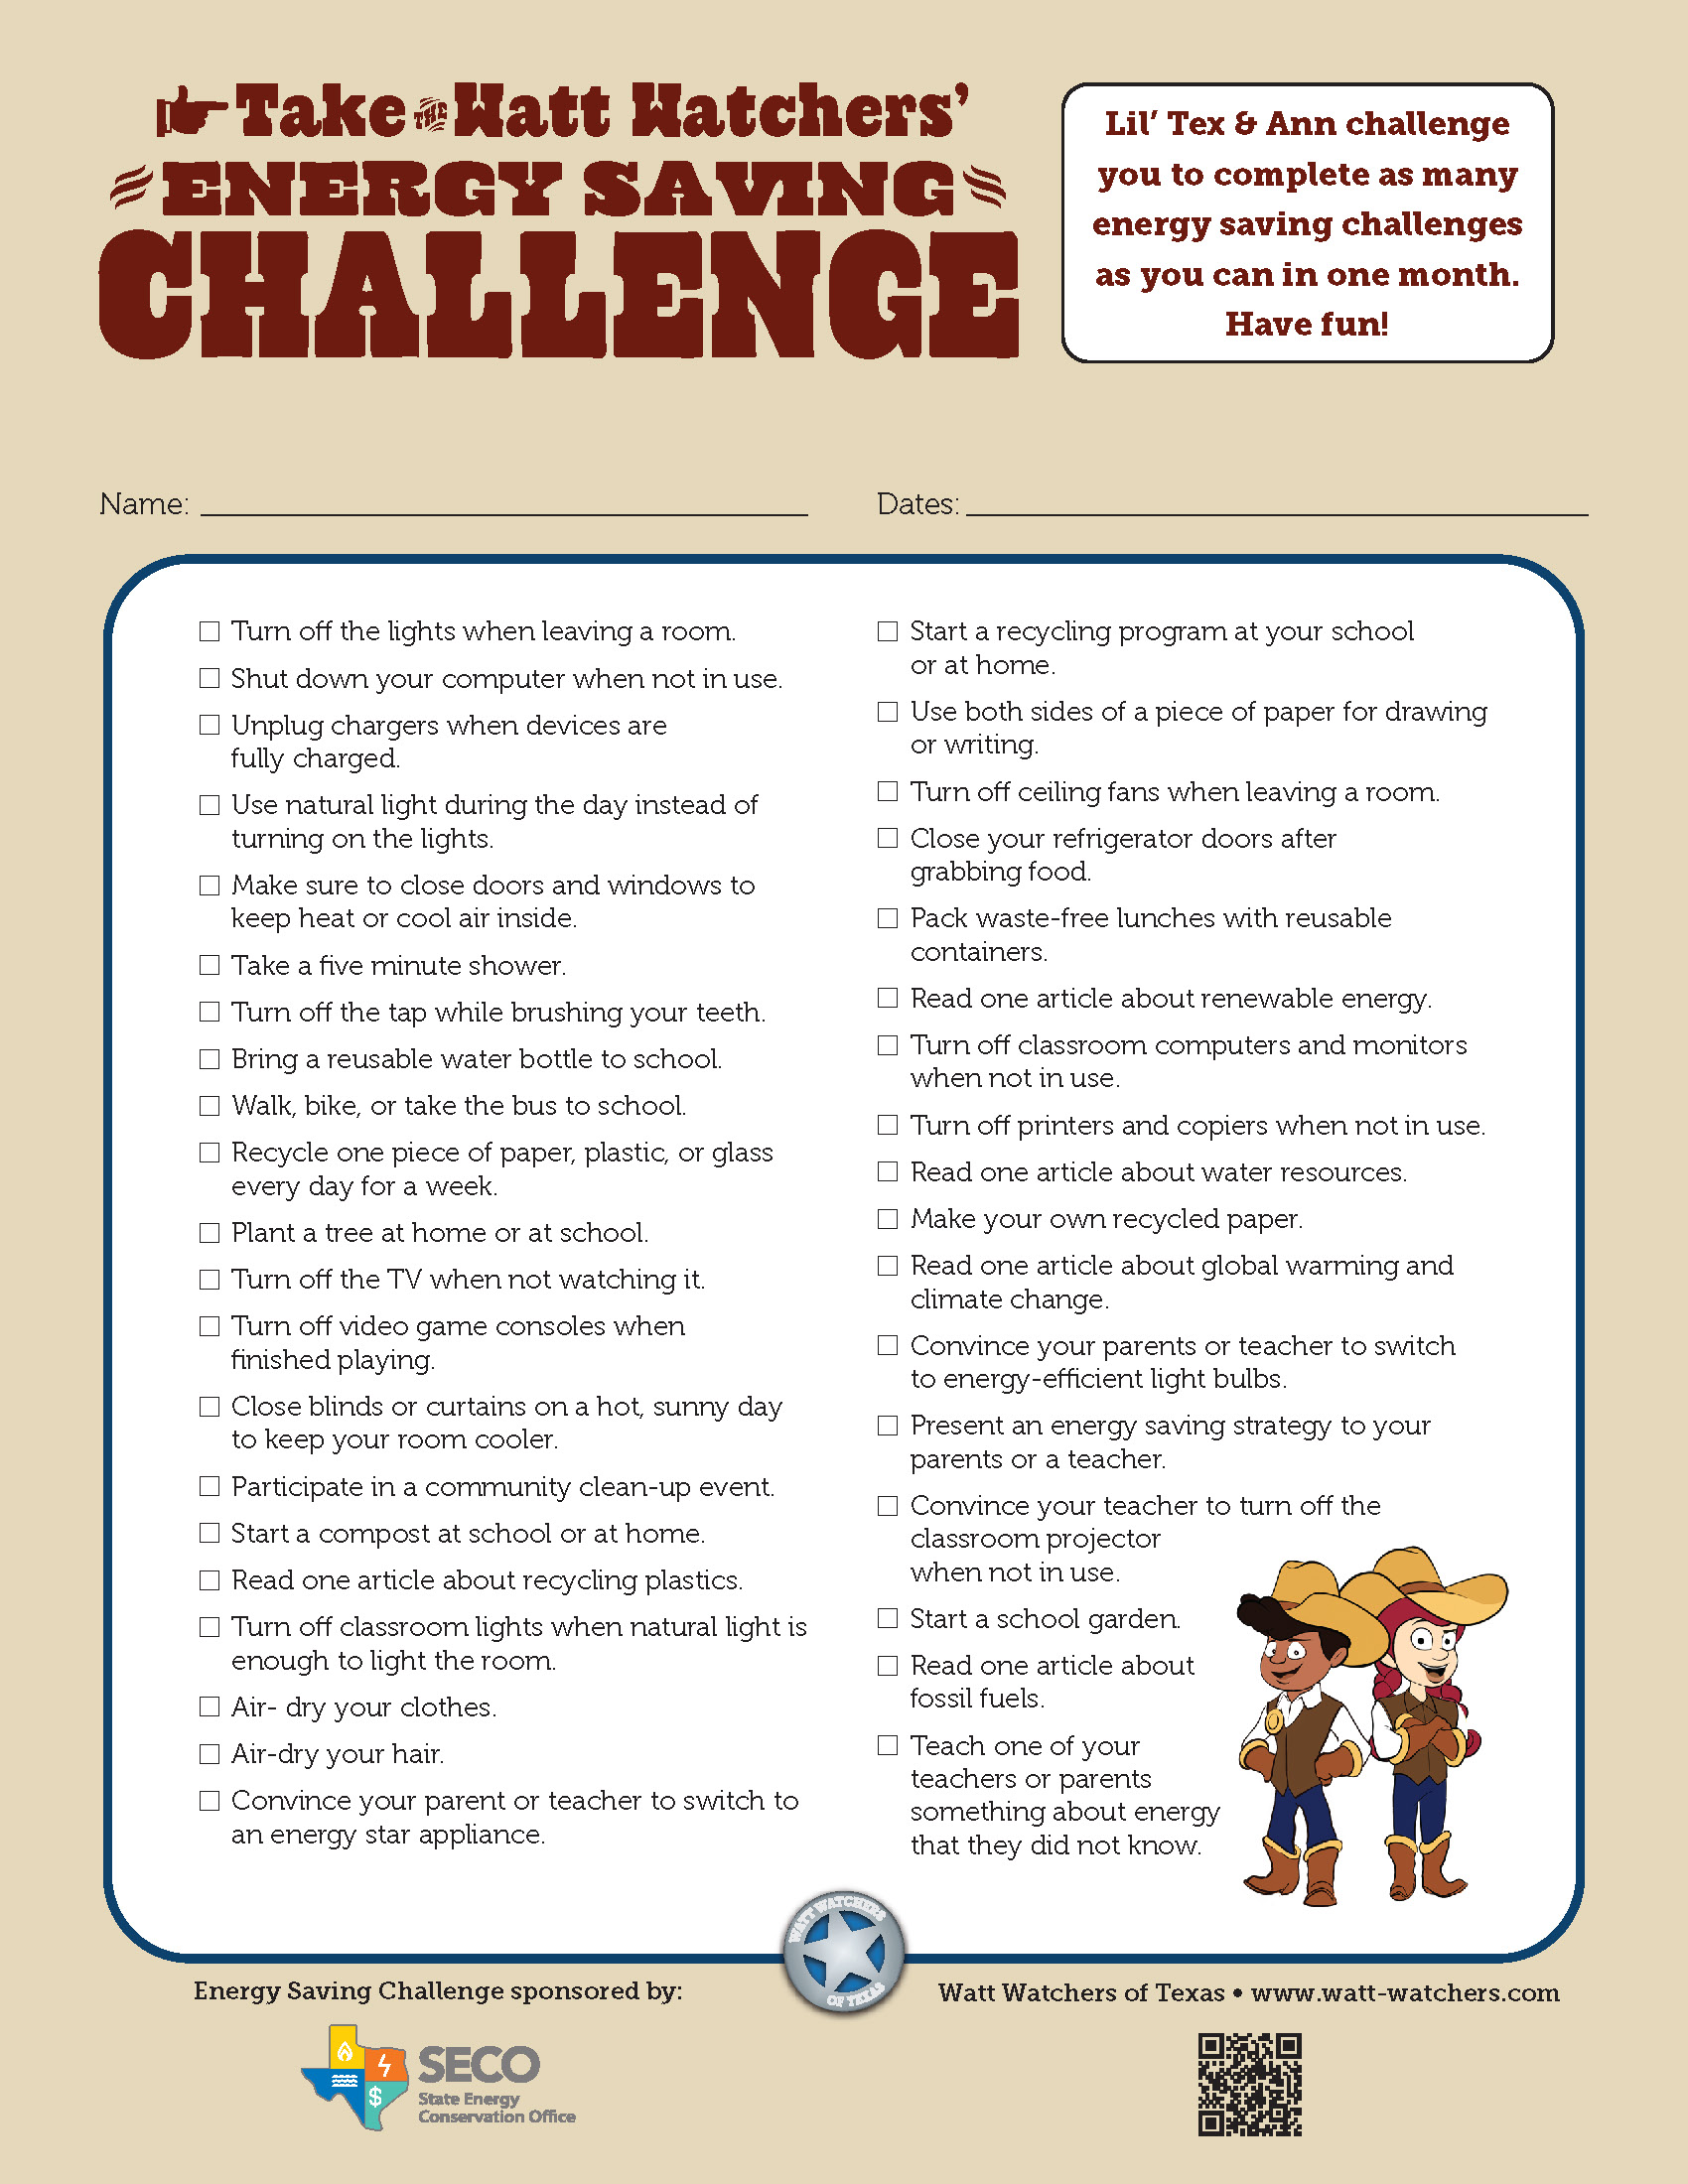
Are you ready to make a difference and save some energy? We’re excited to introduce our latest initiative: the Watt Watchers Energy Saving Challenge! This dynamic challenge offers a fantastic opportunity to spark meaningful conversations about energy conservation in your school while leveraging the Watt Watchers program to achieve real cost savings. Plus, you’ll be giving the environment a much-needed helping hand along the way.
The Energy Saving Challenge is designed to be simple, flexible, and, most importantly, fun. Schools can choose a challenge duration that fits their schedule, whether it’s a quick 7-day sprint or a more extended 30-day commitment. The goal is for students to learn about energy conservation through engaging and fun activities.
Watt Watchers Tip: To keep the momentum going, consider offering exciting rewards like pizza parties, ice cream socials, or extra recess time for the winning classes!
If rolling out the complete Watt Watchers program across your district feels overwhelming, the Energy Saving Challenge is an excellent alternative. Our program’s streamlined approach offers an efficient and effective way for teachers to introduce energy-saving practices to students without requiring extensive planning or resources. Plus, it provides a practical and impactful way to make a real difference in your school’s energy usage.
The Watt Watchers Energy Saving Challenge is here to make energy saving a fun and educational experience for students of all ages. Let’s work together to inspire the next generation of energy savers—one challenge at a time!
Ready to dive deeper into energy education? Visit Watt Watchers of Texas to discover more fun and engaging activities, plus inspiring blogs that will empower your students to become energy-saving champions! Explore now and start making a difference today!
In the United States, climate control is a major driver of energy consumption in the built environment. After all, it's a large country with a vast variety of different climates, ranging from below freezing temperatures in Alaska to the beachy paradise of Hawaii. It's no wonder people seek to make their homes as comfortable as possible. Especially when faced with extreme weather. So how do they do it? By using energy to heat or cool their homes.
Living in the modern world can be very convenient when you have access to energy. Unfortunately, the process of making your space the perfect temperature can be a bit expensive. So the question becomes, how can people heat or cool their homes in the most affordable way possible? One effective way to estimate the energy required for climate control is through the calculation of heating degree-days (HDD) and cooling degree-days (CDD). These metrics provide valuable insights into how much energy will be needed to maintain comfortable indoor temperatures, helping to plan and optimize energy use in residential and commercial buildings alike.
So, what exactly is a degree day? A degree day is a compound metric that measures either the number of days with a 1° temperature change or the number of degrees changed within a single day, which can be useful for both heating and cooling needs. For instance, 10-degree days could represent ten days, each requiring a 1° adjustment or a single day needing a 10° adjustment. This metric helps quantify energy demand for heating (heating degree days, HDD) or cooling (cooling degree days, CDD) based on deviations from a base temperature. Homeowners can use degree day data to their advantage to estimate and budget for energy usage, optimize energy consumption with efficient systems, and save costs. Additionally, it assists farmers and gardeners in planning planting and harvesting schedules by providing a measure of heat accumulation essential for crop growth. Because of this, understanding degree days enables better management of energy needs, leading to cost savings and increased efficiency. Let's analyze these two measurements in more detail.
Heating degree-days (HDDs) are calculated based on the difference between the daily average temperature and a base temperature of 65°F (18°C), which is considered a comfortable indoor temperature. If the average outdoor temperature is below 65°F, the difference between 65°F and the average temperature is the number of heating-degree days for that day. For example, if the daily average temperature is 55°F, that day accounts for 10 heating degree days (65°F - 55°F = 10 HDD).
Keep in mind that the number of heating degree-days varies by region and is influenced by local climate conditions. Colder regions accumulate more heating-degree days annually, indicating a higher demand for energy to maintain indoor warmth. On the other hand, milder climates accrue fewer heating-degree days.
Cooling degree days measure the energy required to cool a building. CDDs are calculated similarly to HDDs but in the opposite direction. When the daily average temperature exceeds the base temperature of 65°F, the difference between the average temperature and 65°F represents the cooling degree days for that day. For example, if the daily average temperature is 75°F, that day contributes 10 cooling degree-days (75°F - 65°F = 10 CDD). Regions with hotter climates accumulate more cooling-degree days, demonstrating a greater need for air conditioning to maintain comfortable indoor temperatures. Alternatively, cooler areas will have fewer cooling-degree days.
Heating and cooling degree-days are essential tools for estimating energy consumption in buildings. By analyzing the degree-days, energy providers and planners can predict the energy demand and optimize the supply accordingly. This information is also crucial for homeowners and businesses to understand their potential energy costs and to make informed decisions about energy efficiency improvements.
To delve deeper into energy concepts and explore a variety of engaging activities, visit the Watt Watchers of Texas. Read our latest blogs and discover fun energy games and activities that can empower you to become more energy-conscious and proactive in your daily life. Take the next step towards a more sustainable future with the Watt Watchers of Texas!
| Activity 1: Looking at Data This activity is appropriate for individuals and for groups. Project or print the following map and graph for your students. Ask them the following questions about the data. U.S. Energy Information Administration Degree-day Regions * Texas is located in which region? [West South Central] * How many regions does the U.S. Energy Information Administration use to analyze degree-days? [9] * Which region has the highest number of heating degree-days? What is the number of heating degree-days in that region? [New England, about 6500 heating degree-days (6518)] * Which region has the highest number of cooling degree-days? What is the number of cooling degree-days in that region? [West South Central, about 2700 cooling degree-days (2747)] * Which region requires more cooling degree-days than heating degree-days? [West South Central] Activity 2: Calculating Degree-days Working as a class or individually, calculate the number of degree-days in a given week. If you undertake this activity in January, you may be considering heating degree-days. If you undertake this activity in August, you will likely be looking at cooling degree-days. The process is as follows. Use the weather almanac, newspaper, or an online weather reporting service to collect and record the mean temperature for the day. Repeat this process for five days. Then calculate the number of degrees between 65°F and the mean temperature of each day. The spread of degrees on a single day is the number of degree-days to record for that day. If the mean temperature is higher than 65°F, then the day collects cooling degree-days, because cooling is required. The opposite is true for heating degree-days. If the mean temperature of the day is 65°F, then record 0 degree-days. At the end of the calculations, take a sum of the number of heating degree-days and the number of cooling degree-days. How many degree-days did your region collect this week? Each degree-day collected contributes to the consumption of energy for cooling and heating. The EIA uses a regional average to calculate the number of respective degree-days to assign to regions throughout the year, but this exercise will introduce students to how quickly energy can be consumed just to keep warm and cool. Example Solution: The data in these tables was taken from a U.S. weather data almanac for Fredericksburg, Texas. The number of degree-days is calculated as the difference between the average temperature and 65°F. Negative differences denote heating degree-days, and positive differences denote cooling degree-days. Therefore, the dates 1 to 5 October accrue 26.15 cooling degree-days. The dates 27 to 31 October accrue 11.45 heating degree-days. A full explanation of degree-days and how the Energy Information Administration calculates and analyzes them is available through the Energy Units and Calculators Explained Series: Degree-Days. These links are being provided as a convenience and for informational purposes only, and the inclusion thereof does not constitute an endorsement or recommendation. Although we make every effort to ensure these links are accurate, up to date and relevant, we are not responsible for content on third-party sites. |
Water is often regarded as a renewable resource, given its continuous circulation through the hydrological cycle. However, despite its seemingly endless accessibility some people have, water is not an unlimited commodity. It is true that the planet is rich with water, yet not all of it is readily accessible or clean. Freshwater, the lifeblood of communities worldwide, is the key to sustaining life and supporting ecosystems. Yet, there's a critical distinction between freshwater that exists and freshwater that is clean, potable, and readily available for human consumption. Glaciers, for instance, store a significant portion of the Earth's freshwater resources in the form of ice. However, accessing this pristine water is often challenging due to its remote locations and the substantial energy requirements for extraction. Compounding this challenge is the accelerating rate of glacier melt caused by global warming, jeopardizing a vital source of freshwater for many regions.
Water usage patterns vary significantly around the globe, with some regions exhibiting alarming levels of overconsumption. Nowhere is this more apparent than in countries like The United States and China, where water usage per capita far exceeds global averages. Factors including extensive agriculture, industrial activities, an overall lack of community resources and a growing population contribute to the strain on water resources, highlighting the urgent need for conservation measures and sustainable practices.
Taking shorter showers, turning off the lights and sealing off leaks can make a big difference when it comes to water conservation. But it’s important to keep in mind that the overconsumption of water extends beyond domestic use and permeates various sectors of industry and agriculture. From manufacturing processes to irrigation in agricultural settings, water is a critical component of production. Because of this, if left unchecked, water usage in these sectors can exacerbate the challenges of climate change and water scarcity significantly. As global temperatures rise and weather patterns become increasingly erratic, water scarcity becomes a pressing concern for communities worldwide. The interplay between overconsumption, climate change, and water scarcity underscores the need for holistic solutions that address both demand-side and supply-side factors. Everyone needs to make changes.
From a consumer perspective, solutions to water-related challenges require a multifaceted approach. Individuals can contribute to conservation efforts by adopting water-efficient practices in their daily lives, such as reducing household water usage, fixing leaks, and investing in water-saving technologies. Additionally, raising awareness about the importance of water conservation and promoting behavior change through education campaigns can foster a culture of sustainability within communities.
Addressing overuse of water is key to a sustainable future. By making some changes in our daily habits and implementing a combination of consumer-driven initiatives, we can work towards a more sustainable water future and ensure equitable access to this precious resource for all.Are you passionate about energy conservation and eager to learn more about how you can make a difference? Take the next step in your energy education journey today! Visit The Watt Watchers of Texas for engaging activities, and Smart Energy Education for career guidance and industry insights. Together, we can create a brighter, more sustainable future!
Only one hundred years ago, obtaining food required significant effort. People grew crops, raised livestock, or ventured out to catch fish, often relying on local ranchers and farmers for their meat and produce. In contrast, today, most people have no idea where their food is grown or raised. The food industry has changed dramatically since the Industrial Revolution. Incorporating machines in agriculture significantly increased the efficiency of food production processes. This, combined with scientific discoveries and new technology, catapulted the world's food systems into their unique, tumultuous state today. Refrigerators and freezers, for example, revolutionized how we store food and our relationship with it. As food preservation became easier, consumer behavior began to shift.
Now, with just a few taps on a phone or computer, it’s possible for someone to summon the meal of their choice to their doorstep within minutes. To make things even more convenient, disposable plastic cups, bags, and food packaging relieve you from the need to wash any dishes. Who doesn't love getting out of chores? The convenience is undeniable, as is the waste and pollution it generates. Food containers, ranging from styrofoam and cardboard to various types of plastics, have a significant impact on the environment.
Styrofoam: Styrofoam, also known as expanded polystyrene, is infamous for its environmental impact due to its non-biodegradable nature. It can persist in landfills for hundreds of years, slowly breaking down into smaller pieces while releasing harmful chemicals. These chemicals can leach into the soil and groundwater, posing risks to ecosystems and human health. Despite its widespread use in packaging and insulation, Styrofoam's environmental footprint has led to increased efforts to find and adopt more sustainable alternatives.
Plastics: Plastics, particularly single-use varieties, are among the most significant environmental threats due to their extensive use and poor recyclability. Items like plastic bags, straws, and bottles are convenient but often end up in landfills or oceans, where decomposing takes centuries. The accumulation of plastic waste leads to pollution that harms wildlife and disrupts natural habitats. Efforts to reduce plastic use and improve recycling rates are crucial in mitigating the adverse environmental impacts of plastic waste.
Cardboard: Cardboard, though biodegradable, often becomes an environmental problem due to inefficient recycling practices. Many cardboard products end up in landfills, where they decompose and release methane, a potent greenhouse gas. This waste represents a significant loss of valuable resources, as cardboard can be recycled multiple times. Improving recycling systems and encouraging proper disposal is key to maximizing the environmental benefits of cardboard as a sustainable material.
Biodegradable Packaging: Biodegradable packaging made from plant-based materials offers a promising solution to the environmental issues posed by traditional packaging. These materials, derived from corn starch, sugarcane, and cellulose, can break down naturally without leaving harmful residues. Biodegradable packaging reduces the burden on landfills and lowers the risk of pollution, contributing to a more sustainable cycle of use and disposal.
Reusable Containers: Reusable containers like glass or stainless steel provide a sustainable alternative to single-use packaging. These materials are durable, easy to clean, and can be used repeatedly, reducing the overall consumption of disposable items. By adopting reusable containers, individuals and businesses can significantly reduce their environmental footprint, conserving resources and minimizing waste.
How often do we opt for pre-packaged convenience without considering the environmental consequences? By evaluating our purchasing decisions, we can make more sustainable choices. By embracing these alternatives, consumers can significantly reduce their ecological footprint. However, addressing the issue of food container waste requires more than just choosing the right materials.
Consumers need to change their perspective on food. Prioritizing convenience over sustainability must become a thing of the past. We can lessen our environmental footprint by making conscious choices and embracing sustainable alternatives. Remember, every small change adds up, and collectively, we can work towards a greener, more sustainable future.
Discover how you can make a difference in conserving energy and protecting our environment by checking out the energy activities on the Watt Watchers of Texas website! Dive into interactive and educational activities designed to teach you practical ways to save energy at home, school, and in your community. Join the movement towards a more sustainable future and become a Watt Watcher today. Visit Watt Watchers of Texas and start your energy-saving journey now!
Grade Level: 7, 8 Theme: Food, Materials Activity Overview: How often do you eat pre-packaged food? Some of the containers for pre-packaged food are made of plastic that cannot be recycled and only end up in a landfill. So what can you do to reduce your plastic waste? Think about what you buy. Does the food you buy come in non-recyclable plastic? Ask yourself if you could get the same food without wasting plastic. For example, instead of buying individually wrapped frozen food, you could make a bulk meal and store it in reusable individual containers.Buy in bulk. Can the food you buy in pre-packaged containers be bought in bulk and stored in reusable containers?There are real, easy ways to reduce the waste that you generate on a daily basis. Plastic takes energy to create and to dispose of. When you are intentional about how to reduce your waste, it helps you to reduce energy as well. Procedure As a class or in small groups, make a list of foods that come in lots of packaging (outside box, inside bag, individual wrappers, lids and bases, etc.). Then brainstorm ways to reduce landfill-destined packaging either by switching the food itself or by changing the packaging. Encourage creativity with these ideas. Even if the idea is unfeasible or still requires packaging, thinking through packaging in the food sector is an important step in reducing overall energy consumption and waste.For example, one can purchase yogurt at the grocery store in a cup with a lid in a multipack of many tethered together in another box or wrapper. Alternatively, one can make a batch of yogurt at home or purchase a large store-bought container of yogurt. This can create multiple single-servings of yogurt in bowls at home or portioned into school lunches by dividing into smaller plastic or glass containers that can be washed and reused. TEKS SCI.6.1B, SCI.7.1B, SCI.8.1B |
Energy is a fundamental concept that drives our modern ways of life. Comprehending the difference between primary and secondary energy sources is, therefore, essential in assessing our energy systems' efficiency, sustainability, and environmental impact. These two categories represent distinct stages in the energy conversion process, each playing a critical role in shaping the outcomes of experiments and influencing everything from policy and industry to scientific discoveries. If you are an educator, follow the link to learn our tips and tricks for teaching about primary vs. secondary energy in the classroom before continuing.
Primary Energy
Primary energy sources are the natural, unconverted forms of energy found in nature, otherwise known as unconverted or original fuels. They are typically the initial sources of energy that undergo extraction or harvesting before they can be used to generate electricity, perform mechanical work, or provide heat. For example, the fuels that can be mined, reaped, extracted, harvested, or harnessed directly.
Primary energy in the form of fossil fuels includes coal, oil, and natural gas, which are the primary energy sources extracted from the Earth's crust. They are burned to release heat energy and generate electricity or power transportation.
Renewable resources include solar energy, wind power, hydropower, and biomass. These resources are harnessed directly from nature, are naturally replenished, and can be converted into electricity or used for heating without depleting the planet's natural resources or causing significant environmental damage.
Finally, nuclear fuel, a zero-emission energy source, is powered by uranium and plutonium. These elements are mined from the Earth and used to create heat through a process called nuclear fission. Despite being a clean energy source due to its lack of carbon dioxide emissions, nuclear fuel can cause environmental damage through mining activities.
Secondary Energy
Secondary energy sources, on the other hand, are forms of energy that result from the conversion of primary energy sources or resources that have been converted or stored. These sources are more readily usable for various applications and are the forms of energy we encounter daily. Secondary energy cannot be harnessed directly from nature; rather, secondary energy is energy that has already been converted. For example, electricity cannot be mined or harvested, though it is available in quick bursts on occasion from lightning. It is generated as a secondary form from primary fuels, like natural gas. Secondary energy includes:
Electricity: Electricity is a secondary energy source that results from the conversion of primary energy sources such as coal, natural gas, or renewable resources. It is versatile and used for lighting, appliances, industrial processes, and transportation.
Heat: Heat is another secondary energy source produced from primary sources like fossil fuels or renewable resources. It is used for space heating, water heating, and industrial processes.
Mechanical Energy: Mechanical energy is generated by engines, motors, and turbines, often powered by electricity or direct mechanical power sources.
The choice between primary and secondary energy sources can profoundly impact the results of experiments and real-world applications. For instance, in a laboratory experiment studying the efficiency of electricity generation, using primary energy data (e.g., the energy content of coal) would provide insights into the inherent losses and efficiency of the conversion process. Conversely, relying on secondary energy data (e.g., the electricity generated from coal) would focus on the end-use application but may overlook the losses associated with energy conversion.
Understanding the difference between primary and secondary energy is vital in energy policy and environmental sustainability. For example, assessing the carbon emissions associated with a particular energy source requires consideration of primary energy sources (e.g., coal emissions) rather than just secondary energy forms (e.g., electricity use), as the latter can mask the environmental impact of the energy conversion process. Likewise, the environmental impact of zero-emission energy resources like tidal energy and nuclear power can often be overlooked.
Because of this, the distinction between primary and secondary energy sources is critical for assessing scientific experiments, energy system analyses, and policymaking. Without having a clear understanding of primary vs. secondary energy, researchers, engineers, and policymakers would be left misinformed on important decisions regarding energy efficiency, environmental impact, and sustainable energy transitions. Likewise, as consumers, it's essential we learn about energy in order to make informed decisions in our personal lives as well as in our communities.
| After researching and discussing each of the different individual energy resources, use time to discuss the difference between primary and energy resources and then to classify each of the following resources into one of two categories. Do this activity in small groups or as a whole class on the board. Time: 20-30 minutes |
Watt Watchers has everything you need to both learn about energy and to teach it in the classroom. Visit us on our website here for the best energy activities and don't forget to check out Resourcefulness for an expanded explanation of primary vs. secondary energy.
Emerging in 1970 amid an environmental movement fueled by mounting concerns over pollution, biodiversity loss, and the degradation of natural habitats, Earth Day has since become an annual global celebration held on April 22nd. Over the years, it has transformed into a powerful force for environmental action, galvanizing millions worldwide to champion environmental awareness and sustainable practices. Today, Earth Day serves as a resounding call to action for individuals, communities, and governments to prioritize environmental stewardship and collaborate towards a more sustainable future. But, above all, it serves as a poignant reminder of our collective responsibility to safeguard and nurture the planet we all call home.
In 2024, Earth Day's central theme, "Planet vs. Plastics," underscores the urgent imperative to combat plastic pollution and achieve a 60% reduction in plastics by 2040. This includes everything from addressing the detrimental impacts of single-use plastics to pushing for legislation to penalize the fast fashion industry for the damage it continues to inflict on our environment. With an eye towards forging a plastic-free legacy for future generations, Earth Day 2024 is dedicated to mobilizing action across various fronts. This includes raising public awareness about the adverse effects of plastic waste on human, animal, and environmental well-being, alongside advocating for a complete phase-out of all single-use plastics by 2030.
In our modern world, plastic seems to be everywhere from our food deliveries and our water bottles to our accessories and shoes. But what exactly are plastics, and how do they impact the environment?
Plastic is a synthetic material made from long chains of molecules derived primarily from fossil fuels known as polymers. It's a material that has become ubiquitous in modern society due to its versatility, durability, and low cost of production. Typical uses of plastic can include anything from packaging and consumer goods to construction materials and textiles. However, it's important to note that not all plastics are equal. There is a wide variety when it comes to plastic types, which are categorized based on both their chemical composition and properties. Some common types include polyethylene (PE), polypropylene (PP), polyvinyl chloride (PVC), polystyrene (PS), and polyethylene terephthalate (PET). This means that while some plastics can be recycled, not all types are equally recyclable. In fact a large amount of plastics are unable to be or are not bothered to be recycled at all, leading to extreme environmental damage.
Plastics became popular in part due to their amazing versatility and durability. After all, a material that can protect goods from the elements at a low cost can be a great asset. However it is this longevity that makes plastic problematic for the planet's health. If left to decompose in a landfill or body of water, plastics can persist in the environment for hundreds of years, contaminating ecosystems and harming wildlife. Lack of regulation and persistent overuse has resulted in millions of tons of plastic waste that today can be found in the planet's oceans, rivers, lakes, soil, and even in the air we breathe. This disrupts natural habitats, threatening biodiversity, and altering the balance of delicate ecosystems.
To complicate things further, plastics can also enter our bodies through various pathways, including ingestion, inhalation, and dermal absorption. Microplastics, tiny plastic particles less than 5 millimeters in size, have even been detected in food, water, and air samples, raising concerns about their potential health impacts. Exposure to plastics and their associated chemicals have additionally been linked to a range of health risks, including reproductive disorders, hormonal disruptions, and respiratory problems. Yet, the plastics alone aren't the only problem. Certain additives used in plastics, such as phthalates and bisphenol A (BPA), have been identified as potential endocrine disruptors with adverse effects on human health.
Various alternatives to traditional plastics have emerged to address the challenges posed by plastic pollution. These include biodegradable plastics made from renewable resources, such as plant-based polymers, as well as innovative materials in the form of compostable plastics and edible packaging. Additionally, initiatives promoting the use of reusable containers, eco-friendly packaging, and sustainable materials aim to reduce reliance on conventional plastics and promote a circular economy model. By embracing alternatives to plastics and adopting sustainable consumption practices, individuals and businesses can contribute to mitigating the impacts of plastic pollution and building a more sustainable future for our planet.
Given the omnipresence of plastics in our modern lives, challenges are inevitable. Therefore, it is imperative to advocate for policies that penalize environmentally destructive industries who rely heavily on these types of materials. Furthermore, prioritizing investments in innovative technologies is crucial to facilitate the transition towards a plastic-free future. As a consumer the best thing you can do is avoid single use plastics whenever possible. Bringing reusable bags to the grocery store, purchasing a metal straw and making use of your favorite reusable water bottle are a great way to start. Are you interested in learning more about the energy sector, energy careers and the impact of our actions on the environment? Visit the Watt Watchers of Texas and Smart Energy Education today to learn more.
As Earth Week approaches, communities around the globe are gearing up to celebrate the planet and to take meaningful action toward its protection and preservation. From April 14th to April 22nd, Earth Day will be commemorated worldwide with events and initiatives that aim to raise awareness and inspire action on environmental issues. This year, Earth Day's primary theme will center around combating the impacts of plastic pollution, emphasizing the urgent need for collective efforts to address pressing environmental challenges that require people to understand many different energy-related topics.
Gaining a holistic understanding of the world's energy and water systems, their relationship with human activities, and their influence on the environment is essential. Because of this, Resourcefulness will be celebrating Earth Week by partnering with Power Over Energy to provide a free screening of the award-winning documentary "Thirst for Power," which will be available on-demand throughout Earth Week, from April 22nd to April 28th, on the Resourcefulness website.
"Thirst for Power," based on the book by Dr. Michael E. Webber, and powered by Itron, Inc. was produced by Alpheus Media, in partnership with The University of Texas at Austin and Disco Learning Media. The film offers a compelling exploration of the intricate relationship between energy, water, and human survival. Through a holistic lens, the documentary sheds light on the interdependence of these resources, underscoring the gravity of the challenges we face and presenting a hopeful array of solutions for a sustainable future.
In addition to the screening of "Thirst for Power," Earth Week 2024 will feature a series of events and activities organized by EARTHDAY.ORG to engage individuals, governments, institutions, and businesses in collective action. These virtual and in-person events will span different time zones, offering opportunities for people from all walks of life to participate and contribute to the global effort towards a greener, more equitable future.
As we celebrate Earth Week 2024 and reflect on the importance of protecting our planet, let us heed the call to action against plastic waste. By joining forces, raising awareness, and implementing sustainable solutions, we can work towards a future where the beauty and abundance of our planet are preserved for generations to come.
We'd love to help answer any questions and help you get started! Drop us a line and we'll get back to you as soon as we can.
Watt Watchers of Texas
204 E. Dean Keeton Street, Austin, Texas 78712
contact@watt-watchers.com
Nos encantaría contestarle cualquier pregunta que tenga y ayudarle empezar! Envíenos un mensaje y nos pondremos en contacto con usted lo antes posible.
Watt Watchers de Texas
204 E. Dean Keeton Street, Austin, Texas 78712
contact@watt-watchers.com